


Income Statements
Sales

Operating Income/
Operating Income margin
Operating Income margin
Net Income/
Net Income margin
Net Income margin
(unit: Millions of Yen)
| FY 2020 | FY 2021 | FY 2022 | FY 2023 | FY 2024 | |
|---|---|---|---|---|---|
| Sales | 92,973 | 116,313 | 140,938 | 158,254 | 162,929 |
| Cost of Goods Sold | 86,402 | 108,689 | 130,457 | 144,349 | 147,517 |
| Gross Profit | 6,570 | 7,623 | 10,480 | 13,905 | 15,412 |
| Total Selling, General and Administrative Expenses |
9,124 | 10,046 | 10,457 | 11,614 | 12,040 |
| Operating Income (Loss) | (2,554) | (2,422) | 23 | 2,291 | 3,371 |
| Recurring Income (Loss) | (2,094) | (2,032) | 94 | 2,574 | 3,044 |
| Net Income (Loss) | (2,843) | (5,189) | (84) | (7,699) | (2,892) |
Balance Sheets
Total Assets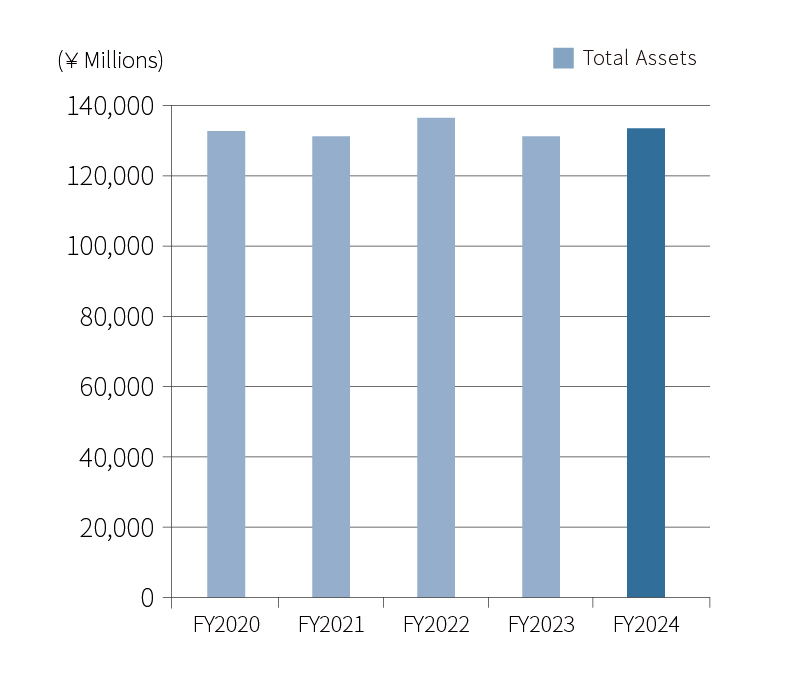
Net interest-bearing debt /Equity ratio
*Net interest-bearing debt = Interest-bearing debt – Cash and deposits
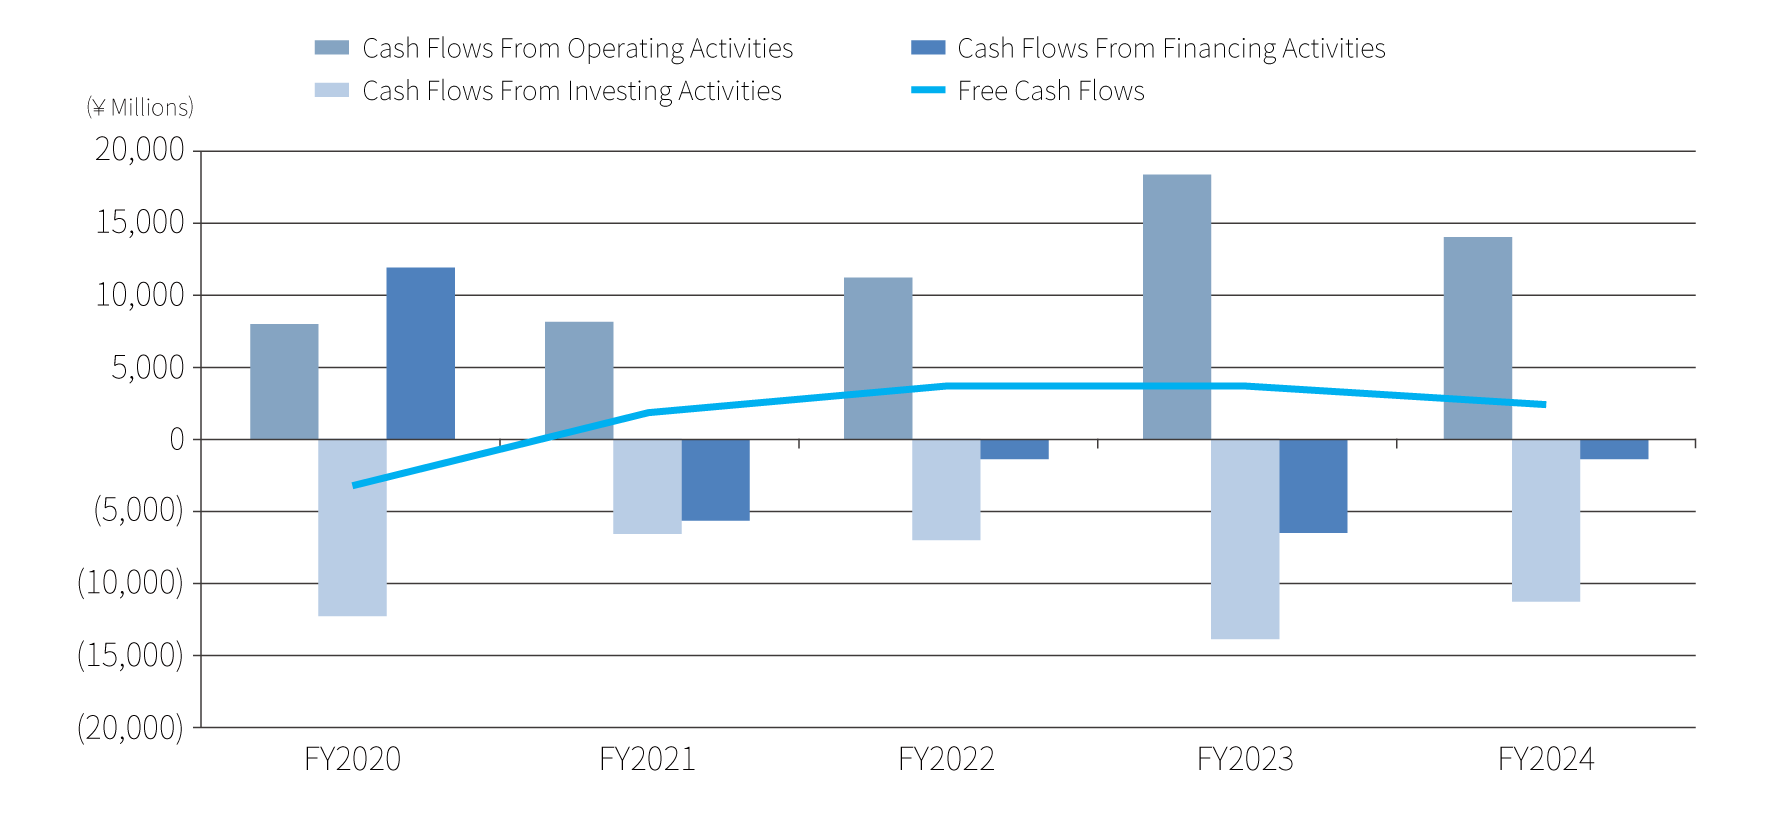
Cash Flows